Network Planner Lite (2014)
NPLite was an experiment created to get a better acquainted with mapping technology and to contribute to Network Planner; a tool for electrification planning in developing countries.
This project is hosted on GitHub.
Try it out
- Go to https://sel-columbia.github.io/nplite/
- Click on the icon in the upper right corner to load the example dataset.

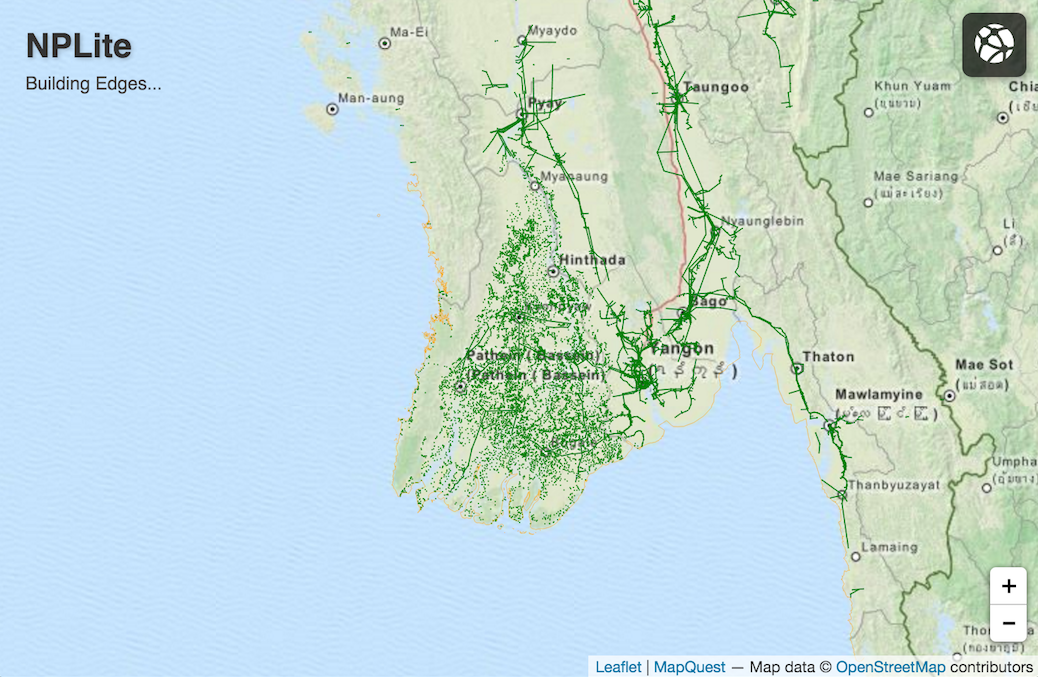
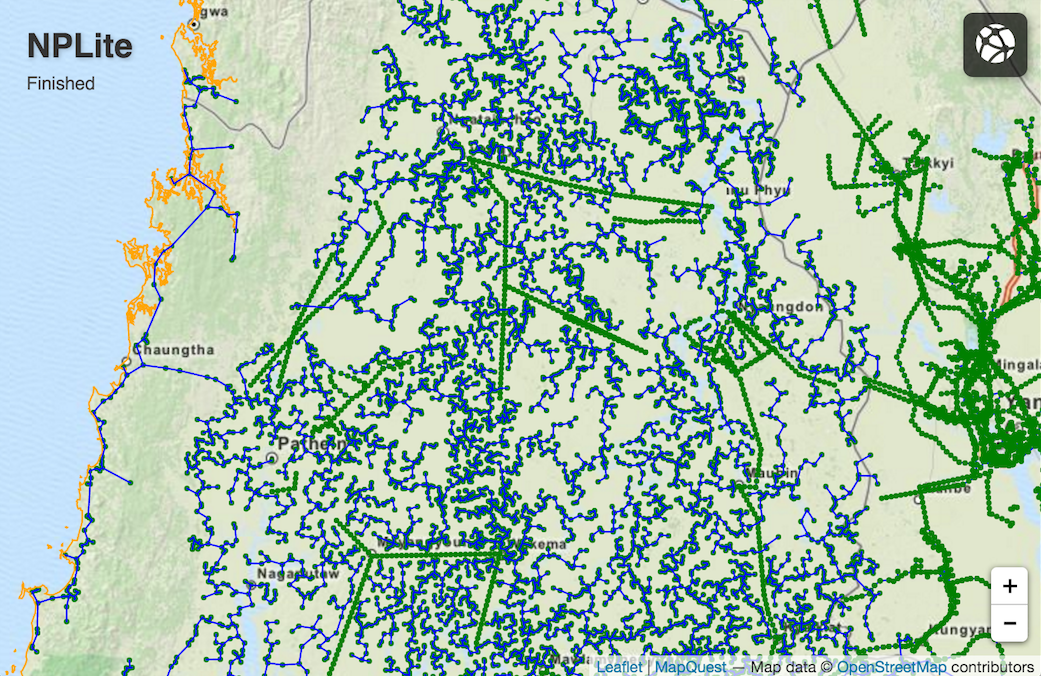
This loads an example with over 10k communities (represented by green dots) in Myanmar and generates a minimum spanning tree to connect them. Blue lines represent the existing power grid and potential connection points. Orange lines represent impassable terrain.
The generation process runs a modified version of Kruskal’s algorithm and creates about 40k proposed power lines (in blue). It runs in about a minute on a Macbook Air.

Built with
- Leaflet: a Javascript mapping library
- D3.js: used to build a custom leaflet SVG layer that supports thousands of nodes and edges
- Web workers: to generate a minimum spanning tree without slowing down the UI
- RBush.js: spatial indexing used to speed up tree generation
- Proj4js: for converting PROJ.4 files to WGS84 coordinates